Fluid mechanics · Collaborative experiments
Fluid Mechanics: Pump Curves & Hydrostatics
Investigated pump pressure–flow behavior and hydrostatic pressure in a collaborative laboratory project with Egyptian exchange students, combining experiments, written reports, and presentations.
Collaborative fluid-mechanics laboratories · Egyptian exchange students · Spring 2025
My contribution
I worked with classmates and Egyptian exchange students on two fluid-mechanics studies and our collaborative reports and presentations. The work connected pressure and volume measurements to pump performance, hydrostatic relationships, regression, and experimental uncertainty.
Results & observations
The team measured a mean flow of 42.43 mL/s with the pump valve fully open and progressively lower flow as the valve closed. The hydrostatic study recorded approximately linear pressure–elevation relationships at four water volumes. These are shared team results; limited operating points and measurement uncertainty constrain the conclusions.
Two experiments, one international collaboration
I worked with classmates and Egyptian exchange students on the experiments, collaborative reports, and presentations. Our reports include Arabic abstracts with English translations. We compared measurements, discussed discrepancies, and presented the findings together.
Lab 1 · Pump pressure and flow
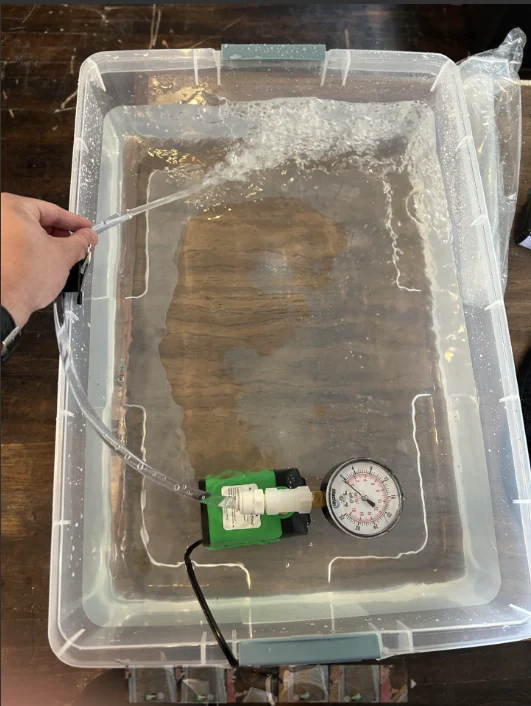
We characterized a submersible aquarium pump by timing collected water volumes and measuring pressure as a ball valve restricted the outlet. Within the valve-test series, mean flow fell from 42.43 mL/s fully open to 11.04 and 6.23 mL/s at the two partially closed positions, then zero at shutoff. We plotted the operating points with uncertainty bars to examine the pressure–flow relationship.
Reading the pump curve carefully
The highest measured mean flow was about 40.4 US gal/hr. That is an operating point from our apparatus, not a measured zero-head maximum. The fitted quadratic did not reach zero pressure within the measured range, so extrapolating it to claim the pump’s maximum capacity would not be supported.
Lab 2 · Hydrostatic pressure and elevation
We tested water volumes of 800, 1,000, 1,400, and 2,000 mL while changing gauge elevation. Pressure increased as the gauge moved farther below the water surface. Linear fits summarized that relationship and supported an estimate of fluid specific weight and column height.
Hydrostatic results and uncertainty
The hydrostatic report estimated a column height near 19.04 inches and compared it with a separate 18.99-inch calculation, while noting that the difference lay outside its stated uncertainty bounds. Gauge resolution, elevation readings, and setup consistency remain limits on the result. The pressure trend agreed with hydrostatic theory, but the height discrepancy needs further investigation.
Tools & methods
- Fluid mechanics
- Pump characterization
- Hydrostatics
- Pressure measurement
- Volumetric flow
- Regression analysis
- Experimental uncertainty
- Technical presentations
- International collaboration