Experimental mechanics
Strain-Gauge Curvature Measurement
Compared strain-derived radius estimates with a circumference measurement to evaluate acquisition range, signal saturation, and uncertainty.
Mechanics of materials laboratory · Measurement and uncertainty
My contribution
I analyzed direct and amplified strain-gauge bridge signals across five acquisition ranges in LabVIEW. I compared the resulting radius estimates with a physical circumference measurement and traced the uncertainty contributed by each measurement method.
Results & observations
The analysis identified the tradeoff between signal resolution and saturation, and the dominant uncertainty sources for each method. It showed why selecting an acquisition range is part of the measurement design, rather than just a software setting.
Measuring a curve electrically
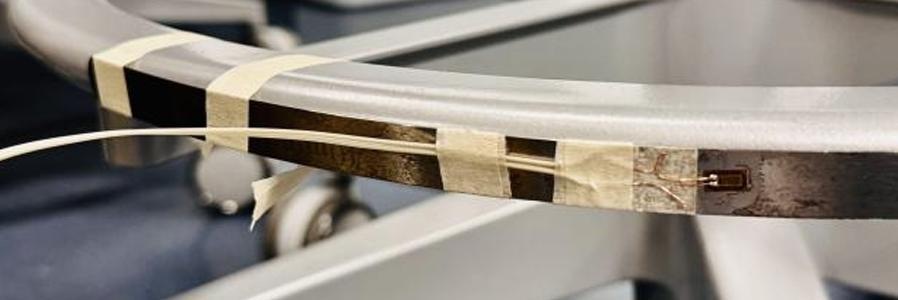
A strain gauge bonded to a flexible feeler gauge formed part of a quarter Wheatstone bridge. I compared direct and amplified signals to estimate the radius of a stool footrest, then checked the result against a circumference measurement.
The acquisition range changes the answer
Five voltage windows exposed two different problems: the smallest ranges saturated the excitation channel, while the largest returned unusable zero bridge readings. More samples cannot repair saturation or insufficient voltage resolution.
Reporting the uncertainty
The report estimated approximately 237 ± 36 mm from the direct channel and 237 ± 23 mm from the amplified channel, compared with about 256.20 mm from circumference. These uncertainty intervals follow the course model and its stated assumptions. Flat-state baselines were inferred from recorded sample groups because the original tare settings were unavailable.
Tools & methods
- LabVIEW
- Strain gauges
- Bridge circuits
- Signal amplification
- Data acquisition
- Uncertainty propagation
- Saturation analysis
- Measurement comparison